1. Command-line Options
To start treeMappa, open a command line window (Run->Command in Windows;
Applications->Utilities->Terminal in MacOS X; a shell in Unix/Linux).
Change directory to that in which treeMappa has been installed, change to the library folder (type cd library)
and type
java -jar treeMappa.jar
followed by one or more of the following parameters:
| Configuration option | Default value |
[align[n] <horizontal|vertical|free>] | free |
[allowVerticalLabels <true|false>] | false |
[border[n] <num_pixels>] | 1 |
[borderColour <#rrggbb_hex_string>] | #000000 |
[cTable <file_name>] | |
[height <num_pixels>] | 400 |
[imageFile <file_name>] | |
inFile <file name> | |
[labelBranches <true|false>] | false |
[labelLeaves <true|false>] | true |
[layout[n] <squarified|orderedSquarified| | orderedSquarified |
spatial | |
sliceAndDice|strip| | |
pivotSize|pivotMiddle|pivotSplit|pivotSpace| | |
morton>] | |
[leafTextColour <#rrggbb[aa]_hex_string>] | #00000096 |
[leafTextFont <font name>] | SansSerif |
[leafVectorWidth <num_pixels>] | 0.3 |
[loadConfig <file_name>] | |
[maxBranchText[n] <font_pt_size>] | 0 |
[maxLeafText <font_pt_size>] | 8 |
[mutation <mutation_level>] | 0.2 |
[outFile <file_name>] | |
[randColourLevel <level>] | 1 |
[seed <long_integer>] | 0 |
[saveConfig <file_name>] | |
[showArrowHead <true|false>] | false |
[showBranchDisplacement[n] <true|false>] | false |
[showLeafDisplacement <true|false>] | false |
[showTreeView <true|false>] | false |
[statistics <true|false>] | false |
[textColour[n] <#rrggbb[aa]_hex_string>] | #00000064 |
[textFont <font name>] | SansSerif |
[textOnly <true|false>] | false |
[transparent <true|false>] | true |
[type <treeML|csv|csvCompact|csvSpatial>] | csv |
[useLabels <true|false>] | true |
[vectorWidth[n] <num_pixels>] | 0.3 |
[verbose <true|false>] | false |
[version] | |
[width <num_pixels>] | 400 |
Where items in [square brackets] are optional and items in italics should be substituted with the relevant
text. Note that all parameters are optional with the exception of inFile which indicates the file
containing the hierarchical data to map. Brackets should not be included in the command line. If any item contains
spaces (e.g. file or font names), they should be enclosed in "quotes"
Alternatively, configuration options can be loaded from a configuration file using the loadConfig option
followed by the name of the configuration file. A configuration file, which uses the XML format, can set any of the
parameters above. If a parameter is not set, the default value is used. Configruation files can be created and edited externally,
or they can be saved from TreeMappa using the saveConfig option.
1.1 Example data
The effect of various command line parameters are illustrated with the following simple three-level tree:
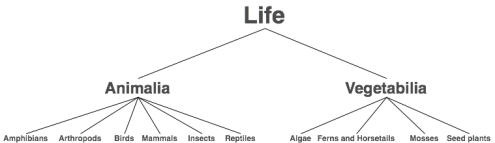
In this example, the categories Life, Animalia and Vegetabilia are referred to as branch
nodes and the remaining categories as leaf nodes.
2. Input Formats
Data representing treemap nodes can be stored in one of four formats, determined by the type parameter:
treeML, csv, csvCompact or csvSpatial. If not specified, input files are assumed to be in csv format.
2.1 TreeML
TreeML was first used in the 2003, InfoVis contest as a simple XML format for representing hierarchical tree structures. See the
TreeML specification
for full details. Nodes are represented as <branch> or <leaf> elements. Branches
can be nested within each other, leaves cannot. Both can contain attributes defining the node's label and leaves can also
contain a value that is mapped to size.
1
2
3
4
5
6
7
8
9
10
11
12
13
14
15
16
17
18
19
20
21
22
23
24
25
26
27
28
29
30
31
32
33
34
35
36
37
38
39
40
41
42
43
44
45
46
47
48
49
50
51
52
53
54
55
56
57
58
|
<tree>
<declarations>
<attributeDecl name="name" type="String"/
<attributeDecl name="number" type="Real"/
</declarations>
<branch>
<attribute name="name" value="Life" /
<branch>
<attribute name="name" value="Animalia" /
<leaf>
<attribute name="name" value="Amphibians" /
<attribute name="number" value="1" /
</leaf>
<leaf>
<attribute name="name" value="Arthropods" /
<attribute name="number" value="1" /
</leaf>
<leaf>
<attribute name="name" value="Birds" /
<attribute name="number" value="1" /
</leaf>
<leaf>
<attribute name="name" value="Insects" /
<attribute name="number" value="1" /
</leaf>
<leaf>
<attribute name="name" value="Mammals" /
<attribute name="number" value="1" /
</leaf>
<leaf>
<attribute name="name" value="Reptiles" /
<attribute name="number" value="1" /
</leaf>
</branch>
<branch>
<attribute name="name" value="Vegetabilia" /
<leaf>
<attribute name="name" value="Algae" /
<attribute name="number" value="1" /
</leaf>
<leaf>
<attribute name="name" value="Ferns and horsetails" /
<attribute name="number" value="1" /
</leaf>
<leaf>
<attribute name="name" value="Mosses" /
<attribute name="number" value="1" /
</leaf>
<leaf>
<attribute name="name" value="Seed plants" /
<attribute name="number" value="1" /
</leaf>
</branch>
</branch>
</tree> |
Only node labels and leaf size can be specified in this format. Node colour is therefore allocated using treeMappa's
default random colouring scheme.
2.2 CSV
This format offers greater control by allowing node label, size, colour, order and location
to be specified. Each line in the CSV file should consist of a leaf node's characteristics defined in the following order:
Label, Order, Size, Colour, x, y, Level0, Level1, Level2 etc.
The Label and Leveln columns must contain data, while the remaining columns can be
blank if their default values are accepted. So for example, the following represents a minimal representation of
the tree of life:
1
2
3
4
5
6
7
8
9
10
11
12
13
|
Amphibians, , , , , ,Life,Animalia
Arthropods, , , , , ,Life,Animalia
Birds, , , , , ,Life,Animalia
Insects, , , , , ,Life,Animalia
Mammals, , , , , ,Life,Animalia
Reptiles, , , , , ,Life,Animalia
Algae, , , , , ,Life,Vegetabilia
Ferns and Horsetails, , , , , ,Life,Vegetabilia
Mosses, , , , , ,Life,Vegetabilia
Seed plants, , , , , ,Life,Vegetabilia
|
By default Label identifies the text label to be associated with a leaf node. A label can be forced to
take up more than one line by inserting a '\n' (without quotes) where a new line is to be placed.
Branch node labels are identified in the same way but using columns Level0, Level1 etc.
If leaves can share the same name, but wish to be identified as distinct nodes in a CSV file, than the parameter
useLabels can be set to false, in which case
the leaf is defined by the final 'level'
value in the CSV file and is allocated the text label according to the 'label' column.
Leaf order can be defined by a number in the Order column where the smaller the number, the higher
the order. Depending on the layout type selected, order is used to determine the position of a given leaf in the
treemap. If two leaves have the same order value, the node's size is used to determine its order (larger nodes are
ordered before smaller ones).
The value of Size determines the relative size of a given leaf node node in the treemap. This can be
any non-zero numeric value. This should usually be associated with some measurement-scale attribute of the
data being represented. If a negative value is given, the node is treated as a dummy and will not be drawn
or used in the statistical summary. Dummy nodes can be used to insert 'spacers' in a treemap. The size of the dummy
node is the absolute value of Size, so a value of -3 would indicate a dummy node of 3 units.
Colour is, by default, a numeric value that is used to associate a leaf node with a colour. This value-colour
mapping is identified in a separate colour table (see cTable) below. If not specified, TreeMappa
allocates an inherited random colour depending on the leaf's position in the hierarchy. Colour can also
be used to represent the RGB values of a node's colour directly (again, see cTable below). Colour can be used
to represent both measurement values (using some continuous gradational colour scheme), or categorical types (shown in the
example below).
If specified, x and y identify the geographic location of a leaf node. This is used by the
spatial layouts to position nodes as closely as possible to their relative geographic location.
An example of a CSV file for the simple tree of life specifying node order, node size and categorical node colour
is shown below:
1
2
3
4
5
6
7
8
9
10
11
12
13
|
Amphibians, 1, 15, 1, , ,Life,Animalia
Arthropods, 2, 55, 2, , ,Life,Animalia
Birds, 3, 15, 3, , ,Life,Animalia
Insects, 4, 84, 4, , ,Life,Animalia
Mammals, 5, 21, 5, , ,Life,Animalia
Reptiles, 6, 20, 6, , ,Life,Animalia
Algae, 7, 10, 7, , ,Life,Vegetabilia
Ferns and Horsetails,8, 8, 8, , ,Life,Vegetabilia
Mosses, 9, 15, 9, , ,Life,Vegetabilia
Seed plants, 10, 45, 10, , ,Life,Vegetabilia
|
2.3 CSVCompact
This is a similar format to CSV described above except that there is no column specifying node order.
Order is controlled by the node size and node colour values. This format exists to ensure compatibility
with earlier versions of treeMappa.
2.4 CSVSpatial
Offers more precise control over spatial positioning of non-leaf nodes by specifying the location of all
nodes in the treemap (the default CSV format just specifies leaf nodes, with branch nodes being the mean
centre of their contained leaves. The format is specified as follows:
Label, Order, Size, Colour, leafX, leafY, Level0, x0,y0, Level1, x1, y1, Level2, x2, y2 etc.
Each branch node (Level0, Level1 etc.) should be followed by an x,y pair specifying its spatial
location. Leaf location is given before all branch nodes (as with the default CSV format) to allow for differing
depths within a tree structure. Note that if the treeMappa option
useLabels is set to false, the final x,y
pair is should contain the same pair of digits as leafX,leafY since they both represent the same
treemap leaf.
The remaining columns are the same as specified in the CSV format.
3. Output Formats
Output is by default to the screen. The image displayed is of dimensions determined by the width and
height command line parameters. The image may be zoomed and panned by dragging the left and right
mouse buttons.
In addition to displaying directly on the screen, treeMappa can output treemaps in a range of graphic and file formats.
The output format is determined by setting outFile or imageFile to a file name with a one of the following extensions.
| Format | treeMappa option | File extension |
| PNG image | imageFile | .png |
| JPEG image | imageFile | .jpg |
| BMP image | imageFile | .bmp |
| SVG image | imageFile | .svg or .svgz |
| ESRI shapefile | outFile | .shp |
| Generic text file | outFile | .txt |
Image files have the dimensions set by the width and height parameters. These can be greater
than the screen dimensions for high quality high resolution image files.
The generic text file format is a comma separated value file where each line is a leaf or branch node label followed by
the treemap coordinates of that node in the order: xmin,ymin,xmax, ymax. This can be useful for incorporating tree maps into other programs.
4. Treemap Layouts
The layout option defines the rules that are applied to arranging treemap nodes. For full details of how
different layout algorithms work, see the section on treemap theory. A brief summary
of the different layout options is given below:
4.1 Layout Types
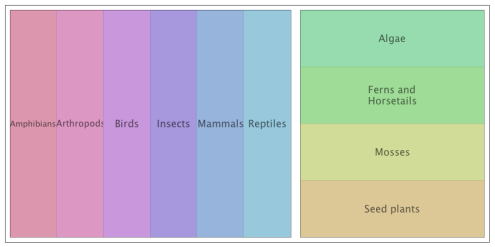
The slice and dice layout processes the nodes at each level of the hierarchy
by dividing the parent node into parallel rectangles proportional to the area of each node. This tends to result in a
series of think rectangles in alternating horizontal and vertical directions. The main advantage of this form of layout
is that it preserves the one-dimensional order of nodes at each level in the hierarchy.
 Slice and Dice layout
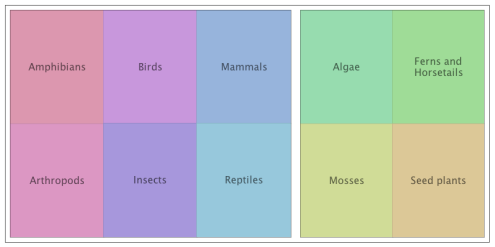
Squarified layouts attempt to divide space in such a way as to make the aspect ratio of
each node as square as possible. This tends to make the nodes easier to interpret, especially when judging relative
area. The main disadvantage of the approach is that node order can be difficult to follow. The squarified
layout type tends to produce the best aspect ratios, while the orderedSquarified layout maintains good
aspect ratios but with improved positioning consistency. This layout is particularly suitable for identifying trends in
the size and colour values in a dataset.
 Ordered squarified layout
The Spatial layout is a variation of the ordered Squarified layout that attempts to
allocate a node closest to its spatial location relative to other nodes in the treemap. It is therefore useful for
treemaps of spatial data where spatial location is to be preserved.
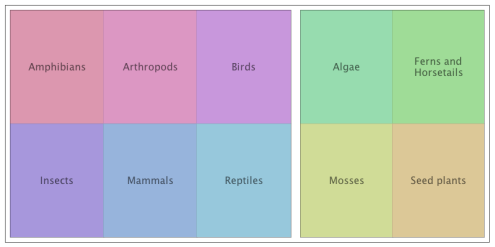
The Strip layout attempts to combine the good aspect ratios of the squarified layouts
with the one-dimensional ordering produce reasonably good aspect ratios. Nodes are arranged in horizontal strips to aid
left-to-right reading across a list of nodes. 'lookahead' searching is applied to improve the aspect ratios of nodes.
This layout tends to be useful for treemaps where individual nodes are to be searched for.
 Strip layout
Pivot layouts attempt to produce reasonably square nodes but fill space by recursively
dividing each node into three smaller rectangles around a 'pivot node'. Remaining nodes are placed in the spaces on
either side of the pivot. For some distributions this can produce squarer or more readable node sequences than some
other layouts. Four pivot variations exist: pivotSize selects the largest unallocated node as the pivot
node; pivotMiddle selects the middle node in an ordered sequence as the pivot node; and
pivotSplit attempts to select a pivot node such that the total area of nodes on either side of the pivot
are approximately equal; pivotSpace places nodes on either side of a pivot according to their geographic
location.
The Morton layout uses a space-filling Morton ordered curve to position nodes.
It has limited application and is only really suitable when there are 2n nodes to allocate.
4.2 Layout Options
It is possible to specify different layouts at different levels in the hierarchy by adding additional
layoutn parameters where n is the level of the hierarchy at which to apply a
give layout. For example
layout orderedSquarified layout2 sliceAndDice
would apply the ordered squarified layout at all levels except level 2 where the slice and dice layout is applied.
Each of the layouts above (with the exception of the Morton layout) may be constrained to partition
space using either horizontal or vertical strips. This may be useful for labelling purposes (horizontal nodes being
easier to label with horizontal text) or for specific data types (e.g. calendar views). The disadvantage of constraining
layout alignment is that it can worsen the aspect ratios of nodes.
Layout alignment is set with the align option which takes the arguments horizontal,
vertical or free (default). The level of the hierarchy at which to apply the alignment constraint
can be controlled with an optional number after the align parameter.
5. Border Control
Each branch in the treemap can be separated from other branches at the same level with the border
parameter where its value gives the width of the border in pixels. Setting a value for border will surround
all branches with the given border. This can be refined further by additionally specifying a border to be applied at
a specific level in the hierarchy, where 0 is the root of the tree, 1 is the first level etc. For example
border 10 border2 5
would apply a 10 pixel wide border at all levels of the hierarchy except level 2 which would have a border of 5 pixels.
By default borders are coloured black but gradually increase in transparency with node depth. The core colour of borders can
be set with the borderColour parameter which takes a six-digit hex value in the form #rrggbb.
6. Node Colouring
The file name following the cTable parameter specifies the rules to convert a node's numeric colour value
into a colour for display. The file should have a .ctb extension. The format of the colour table file is
that used by LandSerf and consists of an XML file containing one or more
rules. A rule consists of a numeric value and the RGBA (red, green, blue, opacity) colour components
associated with that value. Each colour component is scaled between 0 and 255. Colour rules can be discrete,
meaning the rule applies only to the given numeric value, or continuous, meaning that colours are interpolated
between numeric values.
For example, the following file will allocate 10 discrete colours to the nodes with colour values 1 to 10:
1
2
3
4
5
6
7
8
9
10
11
12
13
14
15
16
|
<?xml version="1.0" ?>
<colourTable>
<rule value="1" type="discrete">220,151,175,255</rule>
<rule value="2" type="discrete">220,151,195,255</rule>
<rule value="3" type="discrete">200,151,220,255</rule>
<rule value="4" type="discrete">167,151,220,255</rule>
<rule value="5" type="discrete">151,180,220,255</rule>
<rule value="6" type="discrete">151,200,220,255</rule>
<rule value="7" type="discrete">151,220,175,255</rule>
<rule value="8" type="discrete">159,220,151,255</rule>
<rule value="9" type="discrete">208,220,151,255</rule>
<rule value="10" type="discrete">220,200,151,255</rule>
</colourTable>
|
In contrast, the following file allocates a continuous grey-scale mapping of values between 0 and 100:
1
2
3
4
5
6
7
8
|
<?xml version="1.0" ?>
<colourTable>
<rule value="0">0,0,0,255</rule>
<rule value="100">255,255,255</rule>
</colourTable>
|
Alternatively, a raw colour mapping can be applied, where the numeric values in the 'colour' column of a CSV
file directly represent the colour of the node as a single 32 bit integer in the form aRGB. To use
a raw colour table, the .ctb file should contain the following:
1
2
3
4
5
6
|
<?xml version="1.0" ?>
<colourTable raw="true" />
|
If no colour table is provided, treeMappa allocates a random evolutionary colour scheme to all nodes. By default each node
at level 1 in the hierarchy is allocated a random colour and each child node inherits its parent's colour with a small random mutation.
This helps to distinguish nodes at different levels of the hierarchy. The upper levels of the hierarchy that are allocated random
colours can be set with randColourLevel. So for example, setting this value to 2 would allocate a random colour
to all nodes at levels 0, 1 and 2 of the hierarchy and only nodes at level 3 or below would inherit their parent colour. Setting
randColourLevel to 0 will set all nodes to have the same (randomly assigned) colour but with minor mutations. The degree of
mutation can be controlled with the mutation parameter scaled between 0 (no mutation) and 1 (maximum mutation). The default
mutation value is 0.2.
To force the same set of random colours to be allocated each time treeMappa is run, the seed parameter can be set with any
numeric integer.
7. Node Labelling
By default, only leaf nodes are labelled. To control whether leaves or branches have text labels, set the values of
labelLeaves and labelBranches to true or false as appropriate. Unless
otherwise specified leaf labels are shown in 8 point text. Text size can be controlled by setting maxLeafText
to some numeric value, expressed in font point size. If a value of 0 is given, text will be as large as possible while
fitting inside its node rectangle. Branch text size can be set in the same way with maxBranchText. Branch
text at different levels of the hierarchy can be set with maxBranchTextn where n
is the hierarchy level at which to apply the text size. By default, all labels are horizontal. To allow vertical labels
to be placed in tall thin nodes, set allowVerticalLabels to true.
By default, all lables use a sans serif font. This can be overridden by setting the leafTextFont and
textFont configuration parameters with the name of the font to use. Since the fonts are system dependent, if
a given font is not found, TreeMappa silently defaults to a Sans Serif font. Typical font values might include arial,
"Arial Narrow" (note the quotation marks if the font includes spaces), "Courier New",
Monospaced, SansSerif, Serif and "Times New Roman", but any font
installed on your system should be available to TreeMappa. Branch text fonts at different levels of the hierarchy can be set with
textFontn where n is the hierarchy level at which to apply the font.
The colour used to specify text can be set with textColour followed by a 6 or 8 digit hex string in the form
#rrggbb or #rrggbbaa (equivalent to the colour convention used in HTML and CSS). If colours are not specified, text labelling is slightly transparent to allow overlapping text labels. If colours are specified and
labels are to be transparent, the 8 digit #rrggbbaa version must be used. Transparency for SVG output can be turned on or off with the transparent parameter followed by either true or false. Colour values can be set independently for different levels of the hierarchy by specifying textColourn where n is the hierarchy level at which to apply the text colour. Leaf text labels can be specified with leafTextColour followed by #rrggbb or #rrggbbaa.
8. Node Displacement
The two spatial layouts spatial and pivotSpace attempt to position nodes according to their
relative geographic locations, but inevitably some distortion of locations results when forcing nodes into rectangular
treemaps. The displacement of nodes from their geographic to treemap space can be shown by setting
showLeafDisplacement and/or showBranchDisplacement to true. Displacement is indicated
by a curved arrow with the straight end of the line indicating the geographic location and the curved end the treemap
location of a node. The arrow thickness of branch vectors can be set with the vectorWidth parameter and leaf vectors
with leafVectorWidth, which may be set to any
positive number indicating the width in pixels. Branch vectors are scaled by a factor of 10.
Widths can be set to be a fraction of a pixel wide to produce non-intrusive
faint arrows. Arrow heads may also be optionally displayed according to the parameter showArrowHead.
The appearance spatial displacement vectors can be controlled at different branch levels of the hierarchy with
showBranchDisplacementn and vectorWidthn where n
is the hierarchy level at which to control vector appearance.
9. Statistical Summary
By setting the parameter statistics to true, a number of numerical measures of treemap
characteristics are reported. The exact statistical summaries will depend on the nature of the data and the layout
type selected. These include:
- The layout used at each level of the hierarchy
- The maximum depth of the hierarchy
- The total number of nodes in the network
- The mean aspect ratio of each node where the ratio is expressed as the length of a node's long side divided by its
short side - the smaller the number, the squarer the average node shape.
- Readability as defined by Bederson et al, 2002. This measures the proportion of significant angular
changes required to follow nodes in sequence. Thus a line of horizontal nodes involves no angular change but moving from
the end of one row to the next row would involve a change. Readability values closer to 1.0 suggest tasks that involve
finding a particular node in sequence will be easier.
- Distance displacement (spatial layouts only). Scaled between 0 and 1, a value of 0 indicates that no displacement has
occurred between a leaf's relative geographic location and its treemap location, a value of 1 the maximum possible
displacement of nodes.
- Angular displacement (spatial layouts only). Scaled between 0 and 180o, this indicates the average rotation
between each pair of sibling nodes when transformed from their geographic to treemap location.
- Order-distance correlation. This is the Pearson correlation coefficient between each node's distance from the top-left
corner and its order in the dataset. It is used to indicate the locational consistency of a layout. Values closer to 1
indicate a consistent positioning of nodes making the layout more effective as an indicator of order-related trends
in the dataset.
|