Creating Treemaps
Treemaps are very space-efficient ways of representing data and are particularly suited to hierarchical data. They can be
thought of as 2-dimensional bar charts where both the width and height of a 'bar' is used to represent data magnitudes.

Using the TreeMappa library in Processing
To create and display treemaps in Processing you should first install the
TreeMappa and
giCentre Utilities libraries. TreeMappa does most of the
hard work of laying out and displaying treemaps while giCentreUtilities is used for some of the colour handling in the
treemaps.
For detail on the classes and methods available in treeMappa, see the
treeMappa API
documentation.
For details on how treeMappa itself can be used, see the
treeMappa user
guide.
Once the libraries are installed, treeMappa can be used in your sketches by importing the relevant packages:
import org.gicentre.treemappa.*;
import org.gicentre.utils.colour.*;
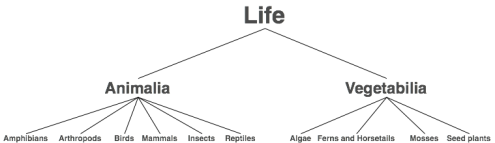
The link between TreeMappa and your sketch is handled by the class PTreeMappa class. Below is a
minimal example that creates a default treemap using PTreeMappa and a simple file
life.csv. This file represents a simple tree of
animals and plants:
1
2
3
4
5
6
7
8
9
10
11
12
13
14
15
16
17
18
19
20
21
22
23
24
25
26
27
28
29
|
import org.gicentre.treemappa.*;
import org.gicentre.utils.colour.*;
PTreeMappa pTreeMappa;
void setup()
{
size(400,250);
smooth();
noLoop();
pTreeMappa = new PTreeMappa(this);
pTreeMappa.readData("life.csv");
}
void draw()
{
background(255);
pTreeMappa.draw();
}
|
This produces the following ouput:
The default settings for a treemap produced this way labels only the 'leaves' of the tree data,
that is, those vlaues that do not enclose any further data inside them. Labels are displayed in the current
processing font and leaf colours, if undefined, will use an evolutionary colour scheme that attempts
to colour leaves slight variations in a randomly selected hue.
Customising treemap appearancce
treeMappa is highly customisable in terms of the text labels, colours, layout and borders around each data item. For
full details of customisation options, see the
treeMappa user guide.
Most of the options detailed there have an equivalent method available from PTreeMappa. The following
example shows an example of a customised version of the life treemap:
1
2
3
4
5
6
7
8
9
10
11
12
13
14
15
16
17
18
19
20
21
22
23
24
25
26
27
28
29
30
31
32
33
34
35
36
37
38
39
40
41
42
43
44
45
46
47
48
49
50
51
52
|
import org.gicentre.treemappa.*;
import org.gicentre.utils.colour.*;
PTreeMappa pTreeMappa;
void setup()
{
size(400,250);
smooth();
noLoop();
textFont(createFont("serif",40));
pTreeMappa = new PTreeMappa(this);
pTreeMappa.readData("life.csv");
pTreeMappa.getTreeMapPanel().setBorders(4);
pTreeMappa.getTreeMapPanel().setBorder(0,0);
pTreeMappa.getTreeMapPanel().setShowBranchLabels(true);
pTreeMappa.getTreeMapPanel().setBranchMaxTextSize(0,80);
pTreeMappa.getTreeMapPanel().setBranchMaxTextSize(1,30);
pTreeMappa.getTreeMapPanel().setLeafMaxTextSize(12);
pTreeMappa.getTreeMapPanel().setAllowVerticalLabels(true);
pTreeMappa.getTreeMapPanel().setBranchTextColours(color(0,50));
pTreeMappa.getTreeMapPanel().setLeafTextColour(color(0,0,80));
pTreeMappa.getTreeMapPanel().setColourTable(ColourTable.readFile(createInput("life.ctb")));
pTreeMappa.getTreeMapPanel().setLayouts("strip");
pTreeMappa.getTreeMapPanel().updateLayout();
}
void draw()
{
background(255);
pTreeMappa.draw();
}
|
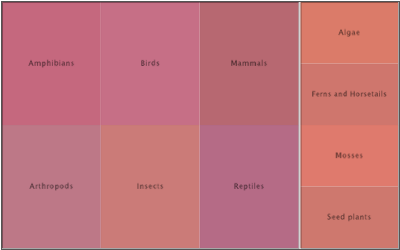
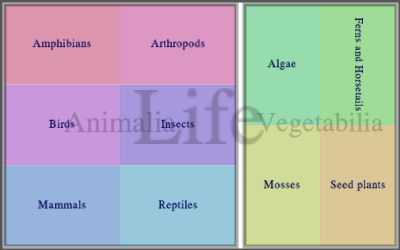
This produces the following ouput:
Customisation of treemap appearance is handled by a TreeMapPanel which takes care of the visual
representation of the treemap. This class contains many appearance cutomisation methods. To get access to the
TreeMapPanel call the getTreeMapPanel() method of the PTreeMappa object.
In the example above, lines 26-27 set the border spacing between adjacent branches. The default distance is
set to 4 pixels (line 26) and then the distance for the branch at level 0 (the root of the tree
representing 'life') is set to 0.
Lines 29-35 customise the colour and size of the text labels. Line 29 ensures that branch labels are displayed
('Life', 'Animalia' and 'Vegetabilia' in this example). Text size for leaves and branches is controlled by
setting a maximum size in pixels. If the rectangle in which the label is displayed is too small for the given
maximum text size, the label is shrunk until it fits inside the rectangle. Text sizes at different levels in
the tree hierarchy can be set by using the two parameter versions of setBranchMaxTextSize() where
the first parameter is the level of the hierarchy and the second is the text size to use. So lines 30-31 set
the level 0 text ('Life') to a maximum of 80 pixels and level 1 text ('Animalia' and 'Vegetabilia') to a
maximum of 30 pixels. Line 33 allows vertical text to be displayed vertically if the the label is too large to
fit horizontally and rotating it proivdes more space. The colour of the labels is set in lines 34-35 (tranparent
grey for branches and a dark blue for leaves).
Treemap rectangle colours can be controlled by associating a colour table with the treemap (see the
treeMappa user
guide for details). The colour table is loaded in line 37 and uses the Processing command
createInput() to load the
file from the sketch's data folder.
TreeMappa comes with a variety of layout algorithms that control how rectangles are arranged. In the example
above, line 39 gets TreeMappa to arrangle rectangles in a StripMap layout (see the
treeMappa user
guide for details).
Finally, because the customisation has altered the layout of the rectangles in the treemap (both setting the
border size and changing the layout algorithm affect layout), we have to call the updateLayout()
method to ensure the new settings are applied (line 43). If you only customise the appearance of the treemap
without changing layout (e.g. changing clours or text labelling), there is no need to call this method.
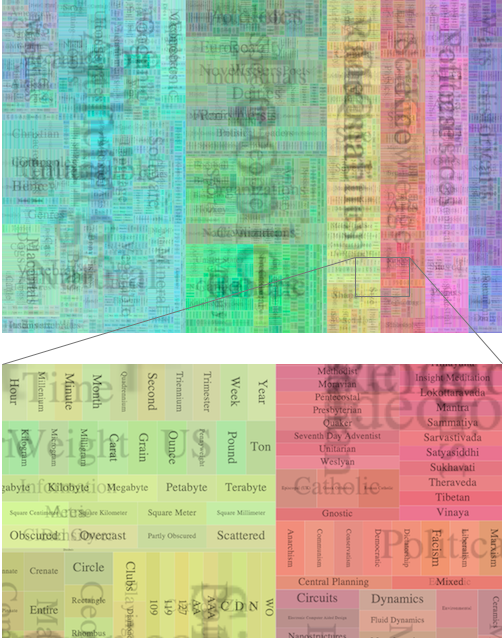
When displaying more complex treemaps with larger numbers of nodes and a deeper hierarchy, it is likely that
not all rectangles will be visiable at once. It is easy to combine PTreeMappa with the
giCentre Utilities ZoomPan class to
create a zoomable treemap.
In the example below, the complex hierarchy stored in the file ontology.xml is displayed. This uses the TreeML format, so requires the file format
name to be specified when reading the data.
1
2
3
4
5
6
7
8
9
10
11
12
13
14
15
16
17
18
19
20
21
22
23
24
25
26
27
28
29
30
31
32
33
34
35
36
37
38
39
40
41
42
43
44
45
46
47
48
49
50
51
52
|
import org.gicentre.treemappa.*;
import org.gicentre.utils.colour.*;
import org.gicentre.utils.move.*;
PTreeMappa pTreeMappa;
ZoomPan zoomer;
void setup()
{
size(1000,700);
smooth();
zoomer = new ZoomPan(this);
textFont(createFont("serif",40));
pTreeMappa = new PTreeMappa(this);
pTreeMappa.readData("ontology.xml","treeML");
pTreeMappa.getTreeMapPanel().setShowBranchLabels(true);
pTreeMappa.getTreeMapPanel().setLeafMaxTextSize(4);
pTreeMappa.getTreeMapPanel().setAllowVerticalLabels(true);
pTreeMappa.getTreeMapPanel().setBranchTextColours(color(0,50));
pTreeMappa.getTreeMapPanel().setBorders(0);
pTreeMappa.getTreeMapPanel().setBorderColour(color(255));
pTreeMappa.getTreeMapPanel().setLayouts("sliceAndDice");
pTreeMappa.getTreeMapPanel().updateLayout();
}
void draw()
{
background(255);
zoomer.transform();
pTreeMappa.draw();
}
|
This produces output similar to tthe following:
|