G - Grid view; M - Map view; Mouse left-drag - Zoom; Mouse right-drag - Pan; R - reset view H - Help screen
The initial map view shows all docking stations as rectangles sized by the capacity of the station. Darker stations are full, lighter stations are empty. Pressing the 'G' key will transform the map into a more useful gridded view where you can see the status of each docking station more clearly.
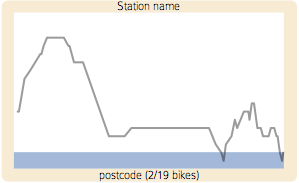
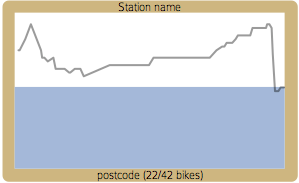
The proportion of bikes at each station is indicated by the height of the blue bar. Very full or very empty stations are shown with a darker or lighter border respectively.
| |
|
|
The status of the bike station over the last 24 hours can be seen as the line moving from left (24 hours ago) to right (present time) between the bottom (empty) and top (full) of the station symbol.So for example, above right shows a steady state at about 50% full between 20 and 8 hours ago and then an increase in docked bikes between 8 and 5 hours ago and a final peak to full capacity in the last hour.
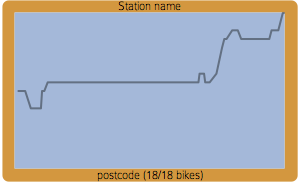
Pressing the 'C' key will give a more accurate represention of the number of bikes at each station by scaling the graph and bar to the capacity of the docking station. This can be useful when comparing numbers of bikes/spaces between stations.
Backdrop mapping derived from Ordance Survey VectorMap District data, Crown Copyright and database right, 2011.