

-

Our location is in the heart of London
-

Named as the greenest university in London
-
3
rd in London for student satisfaction
About
City has been at the leading edge of computer science in the UK for six decades – including laying the groundwork for the foundation of the British Computer Society and awarding some of the country’s first Computer Science degrees.
Today’s department is leading research and education in emerging fields such as artificial intelligence, machine learning, data presentation, gaming, software reliability and cyber security. Our internationally renowned academics study new technologies and our relationships with these, to develop more useful and reliable systems which better society.
The department benefits from City’s central London location; allowing for close ties with industry and a wide range of professional sectors, leading to one of the UK’s highest rates of graduate employability and a host of research-led enterprise opportunities.
Study
The department offers a range of courses at undergraduate, postgraduate taught and research degree level.
Undergraduate
- BSc (Hons) Computer Science
- MSci (Hons) Computer Science
- BSc (Hons) Computer Science with Games Technology
- MSci (Hons) Computer Science with Games Technology
- MSci Computer Science with Cyber Security
- MSci Data Science.
Foundation
Postgraduate
- MSc Artificial Intelligence
- MSc Computer Games Technology with VR
- MSc Cyber Security
- MSc Data Science
- MSc Human-Computer Interaction Design
- MSc Software Engineering with Cloud Computing.
Postgraduate online
- MSc Computer Science
- MSc Computer Science with Artificial Intelligence
- MSc Computer Science with Cyber Security
- MSc Computer Science with Data Analytics
- MSc Computer Science with Software Engineering.
Research degrees
Related subjects
Research
The Department of Computer Science undertakes its world-class multi-disciplinary research through the following research centres and groups:
- Artificial Intelligence Research Centre (CitAI) - Specialising in the intersection between the development of novel AI techniques, Explainable AI (XAI) and Artificial General Intelligence (AGI).
- giCentre - Data presentation, visual analytics, visual storytelling, cartography and statistical graphics.
- Research Centre for Software Reliability - Assessment and assurance of the dependability of systems in terms of safety, security and reliability.
- Research Centre for Human-Computer Interaction Design - Creating more useful and usable systems by studying the relationship between people and technology.
- Research Centre for Adaptive Computer Systems and Machine Learning - Research on neural-symbolic computing, knowledge extraction from big data and explainable AI, Semantic Web technologies and knowledge graphs, and analysis of rich media information.
Our research is carried out according to our ethics policy. Specific details about the Computer Science Research Ethics Committee are also available.
Staff
Academic staff
- Dr Vitaly Aksenov, Lecturer in Computer Science
- Professor Eduardo Alonso, Professor of Artificial Intelligence & Computer Science Research Director
- Dr Bakhtiar Amen, Lecturer in Computing (Online Education)
- Professor Gennady Andrienko, Professor
- Professor Natalia Andrienko, Professor
- Professor Golnaz Badkobeh, Head of Department of Computer Science
- Dr Belen Barros Pena, Lecturer in HCI
- Dr Marjahan Begum, Lecturer in Computer Science
- Dr Dhawal Beohar, Lecturer in Computer Science (Education)
- Professor Peter Bishop, Professor
- Professor Robin Bloomfield, Professor of System and Software Dependability
- Dr Tracey Booth, Lecturer in Computer Science
- Dr Daniel Chicharro, Lecturer in Computer Science
- Dr Chris Child, Associate Dean for Employability & Corporate Relations
- Professor Artur d'Avila Garcez, Professor of Computer Science
- Dr Laure Daviaud, Senior Lecturer
- Professor Jason Dykes, Professor of Visualization
- Dr Mai Elshehaly, Lecturer in Computer Science
- Dr Cristina Gacek, Senior Lecturer
- Dr Ilir Gashi, Reader
- Dr Panos Giannopoulos, Lecturer in Computer Science
- Dr Alim Gias, Lecturer in Computer Science (Education)
- Dr Sara Heitlinger, Senior Lecturer
- Dr Jacob Howe, Senior Lecturer
- Mike Hudson, Honorary Visiting Fellow
- Dr Sebastian Hunt, Senior Lecturer
- Dr Radu Jianu, Lecturer in Computer Science
- Dr Ernesto Jiménez-Ruiz, Lecturer in Artificial Intelligence
- Dr Elahe Kani-Zabihi, STEM Digital Academy Senior Lecturer
- Dr Christos Kloukinas, Reader
- Dr Nikos Komninos, Senior Lecturer
- Dr Michal Krol, Senior Lecturer - in Biomedical Engineer
- Professor Bev Littlewood, Emeritus Professor
- Dr Andrew Macfarlane, Reader in Information Retrieval
- Dr Pranava Madhyastha, Senior Lecturer
- Dr Stephann Makri, Senior Lecturer
- Dr Esther Mondragón, Senior Lecturer in Artificial Intelligence
- Martin Nyx Brain, Lecturer in Computer Science
- Dr Ross Paterson, Lecturer
- Dr Peter Popov, Associate Dean (International)
- Dr Andrey Povyakalo, Senior Lecturer
- Dr Ernesto Priego, Senior Lecturer
- Mohammad Ehsan Rangiha, Visiting Lecturer
- Dr Constantino Carlos Reyes Aldasoro, Senior Lecturer
- Dr Kizito Salako, Lecturer in Computer Science
- Dr Marc Serramia Amoros, Lecturer in Computer Science
- Dr Aidan Slingsby, Senior Lecturer
- Dr Peter Smith, Senior Lecturer in Computing
- Professor George Spanoudakis, Professor of Software Engineering
- Dr Vladimir Stankovic, Senior Lecturer
- Dr Thomas Stead, Lecturer in Human-Computer Interaction
- Professor Lorenzo Strigini, Professor of Systems Engineering
- Dr Giacomo Tarroni, Senior Lecturer in Artificial Intelligence
- Dr Christos Tzelepis, Lecturer in Computer Science
- Dr Martin Walter, Lecturer in Computer Science
- Dr Tillman Weyde, Reader
- Professor Stephanie Wilson, Professor of Human-Computer Interaction
- Professor Joseph Wood, Professor of Visual Analytics
- Dr David Wright, Hon. Research Fellow
Emeritus Professors
- Professor Bernard Cohen; Professor Emeritus
- Professor Bev Littlewood; Professor Emeritus
- Professor Stephen Robertson; Professor Emeritus
News
-
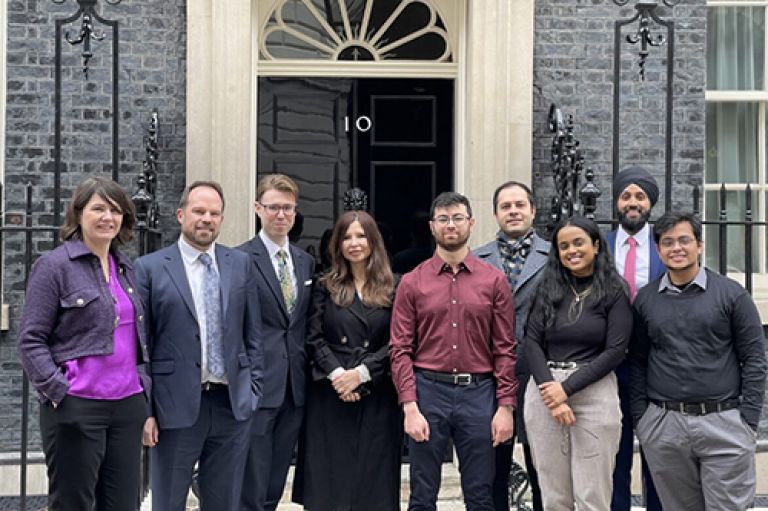
City hackathon participants invited to 10 Downing Street
Students enjoy tour of Number 10 Downing Street after working with civil servants in a successful AI Hackathon last summer.
-
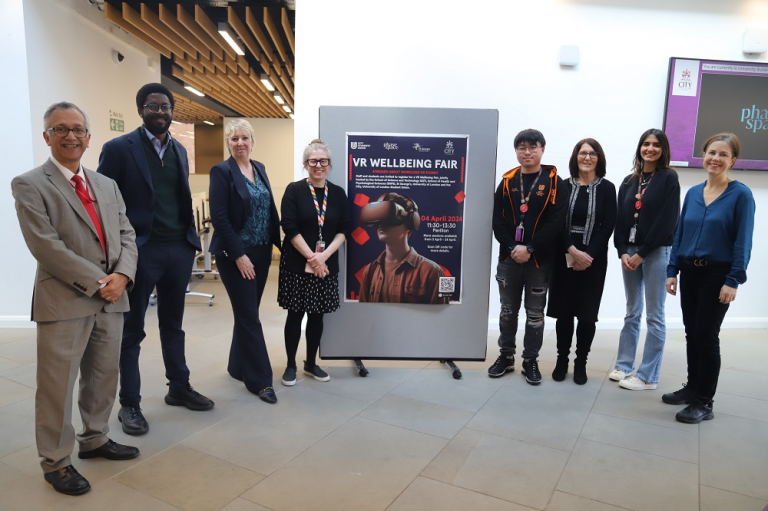
Launch of the VR Wellbeing Fair with Phase Space
Jointly hosted by City’s School of Science & Technology, School of Health & Psychological Sciences, St George’s, University of London and our Student’s Union.
-
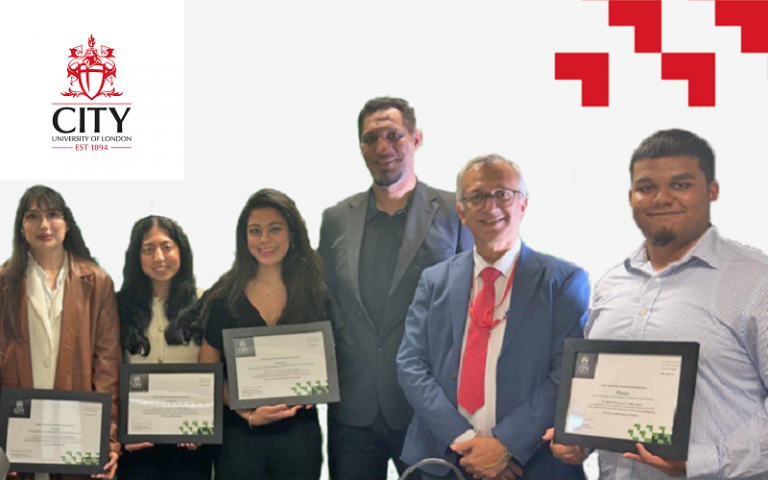
Four receive School of Science & Technology (SST) Dean’s Award Professional Experience (DAPE)
Established by the SST’s Corporate Relations & Employability Unit, the Award recognises students who have produced excellent work during their placement year.


Events
Contact us
Find us
-

Northampton Square
City, University of London
Northampton Square
London EC1V 0HB
United Kingdom